Connecting the dots: knowledge graphs for all


There is a famous saying by the pioneering linguist John Rupert Firth, that ‘you shall know a word by the company it keeps’. Nothing exists in isolation – it’s not enough to know that a document mentions words such as love, poetry, or people such as Keats, Wordsworth, and places such as Paris. We want to know the context in which words and concepts are described and how these relate to their mentions in other documents. These relations, or links, are the concern of knowledge graphs: how are the things we are interested in related to one another, and what new relationships can we discover? Knowledge graphs have been around for a long time, but until recently have mostly been the preserve of academic and industrial research around the semantic web, ontologies, and taxonomies, where subject experts craft models of the important concepts in specific subject domains, define how these concepts are related, and then locate and describe these concepts and relationships within documents on the web.Advances in machine learning have allowed some of this work to be automated. Knowledge bases can be induced from large collections of documents, with concepts and their relationships to each other defined and classified, and then expressed in a machine-readable format. Graph databases such as Neo4J allow this formalised knowledge to be deployed at scale relatively easily.
The rise of personal knowledge management tools
But probably the biggest shift seen in recent years is the rise of personal knowledge management tools that allow anyone to build their own knowledge graph and make it part of their regular reading, writing, or studying workflow. These tools include Roam, Obsidian, and Notion, and they allow you to capture and link daily notes, thoughts, ideas, concepts, to-do lists, and annotated documents into a single connected web of knowledge. Most provide web, desktop, and mobile apps, so you can capture and synchronise your notes on any device. These tools market themselves as ‘second brain’ productivity tools for ‘networked thought’, and provide a digital approach to implementing note-taking approaches such as Zettelkasten and bullet journal. Probably the two, key advances over the previous generation of productivity tools are the ability to structure information into ‘blocks’ rather than documents, and the ability to create backlinks. Backlinks, first implemented by Roam, work like a citation graph and allow you to see not just what other items a block links to, but all the other items that link back to that block.

From documents to knowledge graphs in a few clicks
One problem shared by all note-taking tools when first getting started is the ‘blank page problem’. How do you overcome inertia and structure your thoughts? You may already have notes and documents in other formats: in Microsoft Word, Google Docs, in Evernote, as Apple Mac Notes files, as plain text files, or as complete PDF files. Fortunately, many of these tools provide options to import these different file types. But whichever personal knowledge graph tool you are using, importing your existing documents won’t show you how they are connected to each other unless you manually create those links.How might we find a solution to this? Well, many of these tools use an underlying data format called Markdown – an expressive, plain text format that describes how blocks of text and individual words/concepts are connected and formatted. Perhaps if there were a way to convert any document format into Markdown, while automatically identifying the key concepts and shared references, we could create the starting point for our personal knowledge graph from our existing document collections?It turns out there is a way! Scholarcy can import most document formats, and you can also paste in text directly. It then enriches these documents with concept links as part of our unique flashcard format. And the best bit is that you can export your flashcards as Markdown so that they can be imported into Roam, Obsidian, Notion, and many other tools that use that data format. Let’s have a look at an example, using Obsidian.In our Scholarcy Library, we have a folder with a small number of research papers from a neurology RSS feed. First, we’re going to export these to Markdown:

This will create a zip file on our computer, when we double click on that, we get a folder containing each paper converted to Markdown. Let’s drop that folder into our Obsidian library and then open them in Obsidian’s graph view by selecting the ‘Open graph view’ icon on the left, and sliding the ‘Tags’ slider to the right:

This shows how the documents are related by the concepts, methods, findings, and references that they have in common:
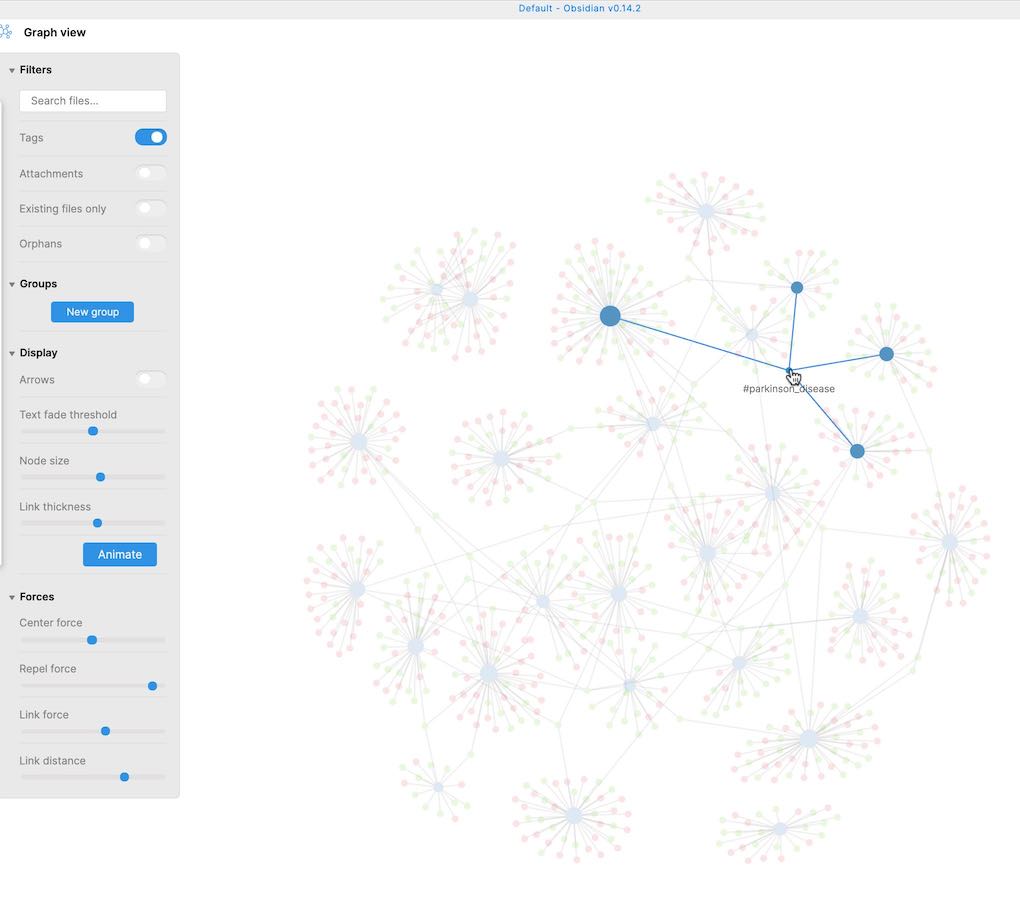
We can see clusters of connections for concepts such as Parkinson’s Disease. Let’s start typing that in the ‘Search files’ filter to show just those papers that share that ‘Parkinson’ concept:

Let’s select one of those papers to zoom in on the key contributions of that study, and how these compare with previous work – Scholarcy extracts this information automatically for you:

The great thing about having this information in our personal knowledge graph is that now we can see related documents in our collection – in Obsidian, these are shown on the left-hand side. The forward and backward links between them have been created automatically by Scholarcy, but we can easily edit this information in our knowledge graph tool, as it is just a plain-text Markdown document.This process works with any export from Scholarcy. Here, we have taken an RSS feed from the Society section of The Guardian newspaper. By filtering on the term ‘housing’ we can see sub-clusters for terms such as ‘social housing’:

And then we can zoom in on a specific one and see its connection with other social housing articles – in this case, those that also mention the term ‘homelessness’:

Even better, if we combine all our research papers and news articles into a single knowledge graph, we can easily navigate and find connections between them – in this case, healthcare issues affecting those precariously housed.

I hope this helped demonstrate how easy it is to explore collections of documents and their connections by combining the processing power of Scholarcy Library, with the expressive power of personal knowledge management tools such as Obsidian. And the great thing is that all this information is editable, so you can easily add your own notes, annotations, and links.